I am proud to release Fyne UpDown: an open source network traffic monitor that is written in Go and built on top of the Fyne toolkit. It lives in the system tray and shows two animated meters for download and upload speed, just like UpDown Meter by ScriptFUSION does. I have always liked that little Windows tool.
Back in the 90s I used DU Meter by Hagel Technologies to watch my dial-up connection. It showed the download and upload speed in a small graph, so you could see if your modem was busy. UpDown Meter brought that idea to the tray icon and Fyne UpDown continues that tradition.
With Fyne UpDown I can see at a glance in the tray whether my network is busy. Hovering the icon tells me the exact speeds.
The tray icon is flat and the meters stand upright: download on the left in green and upload on the right in red, as uploads are the ones to watch. The meters are sampled once per second and their full scale is the link speed that the adapter reports. Like in UpDown Meter you can set the scale per adapter, separately for download and upload, by picking a preset or typing a speed like 50M, 2.5G or 512k. This comes in handy for wireless adapters on Linux, as they do not report a link speed at all.
Graph and adapters
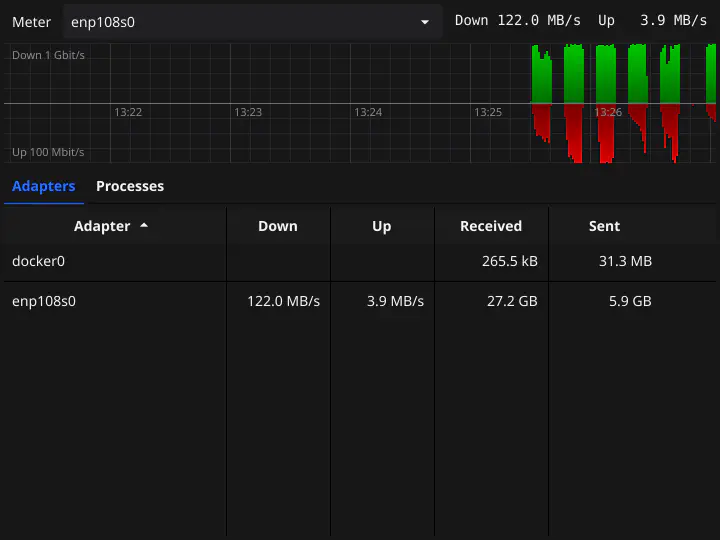
When you click Show in the tray menu a window opens with a graph of the recent traffic, like btop does: download above the axis and upload below it. Each second takes two pixels, so a wider window shows more history (up to an hour). Below the graph you find the current speeds and totals of each network adapter. The meter shows the adapter you select at the top, or the one with the most traffic when set to Auto.
Traffic per process
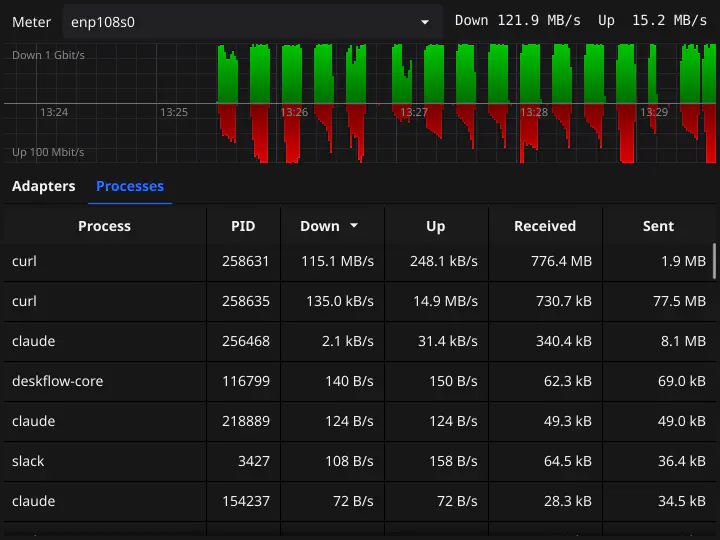
The most important feature that UpDown Meter does not have is the Processes
list. It shows the current speeds and totals of each process since the app was
started. Clicking a process opens a window with its path, command line, user and
start time, and the traffic per remote host, port and protocol. Operating
systems do not offer per-process traffic counters to normal users, so each
platform has its own implementation. On Linux packets are captured on a raw
socket and linked to processes via /proc, like nethogs does, which requires some
capabilities to be set. On Windows the kernel network ETW provider is used,
which requires administrator rights. On macOS the output of the built in
nettop command is read.
Fyne UpDown helps me to find out which process is eating my bandwidth without having to open a terminal and run nethogs.
The application is read-only by design: it shows your traffic, but it does not block or shape it. Are you a software developer and do you want to help test on Windows or macOS? File an issue on Github:
https://github.com/mevdschee/fyne-updown
Enjoy!